NOMINAL DATA: Association of a Bivariate Distribution
A. Association: Lambda
fr + fc - (Fr + Fc)
2N - (Fr + Fc)
Where: N = total in sample
fr = largest number in each row
fc = largest number in each column
Fr = largest row total
Fc = largest column total
Example:
| MAJORS | |||||
| SOCIO-LOGY | SOCIAL WORK | CRIMINAL JUSTICE | OTHERS | ||
| MALE | 23 | ||||
| FEMALE | 43 | ||||
| 66 |
Q1: What is the association between majors and sex?
A1:
![]()
2. Asymmetrical Lambda = ![]()
Where: N = total in sample
fi = largest number in a category of the independent variable
Fd = largest subtotal for a category of the dependent variable
Assumptions: The independent and dependent variables must be
identified. The dependent variable is the variable being predicted.
Example: (Use the data table above.)
Q2: What is the association between majors and sex of student when trying to predict major from a knowledge of sex?
A2: Major is the dependent variable. Sex is the independent
variable.
![]()
Example:
Q3: What is the association between majors and sex of student when trying to to predict sex from a knowledge of majors?
A3: Sex is the dependent variable.
Major is the independent variable.
![]()
Interpretation: Use scale below or convert to percent
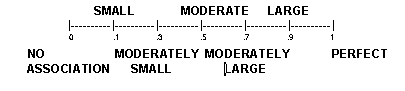
Lambda symmetrical: "There is a ______ association between (variable 1) and (variable 2)" or convert to a percent and include in the statement, "There is a ____% improvement when trying to predict both variables simultaneously from the knowledge of each other".
Interpretations for
Lambda asymmetrical: "There is a_______association between
(variable 1) and (variable 2)." or convert
to a percent and include in the statement, "There is a ____%
improvement when trying to predict (dependent variable)
from the knowledge of (independent variable)."
Example:
Q1 = Small association between sex and major.
24% improvement when trying to predict both variables
simultaneously from a knowledge of each other.
Q2 = Small association between sex and major.
18% improvement when trying to predict major from a knowledge of sex.
Q3 = Moderately small association between sex and major.
35% improvement when trying to predict sex from a knowledge of
major.
B. Phi coefficient (): = ![]()
Where:
Assumptions:
dichotomous variables: each variable has exactly 2 categories (e.g. gender; yes, no).
discrete categories: a basic unit that cannot be subdivided
(e.g. children, the number of children can only be whole numbers.
There is no such thing as 1.5 children).
Example: Have you paid for or been paid for sex?
| MALE | FEMALE | ||
| YES | 112 | 12 | 124 |
| NO | 505 | 822 | 1,327 |
| 617 | 834 | 1,451 |
Q: What is the association between commercialized sexual
relations and gender?
A: = ![]() = .30
= .30
*These are the subtotals for rows and columns;
it is not necessary to put them in any order.
Interpretation: Use scale. "There is a ______ association
between (variable 1 category in upper left corner) and
(variable 2 category in upper left corner)."
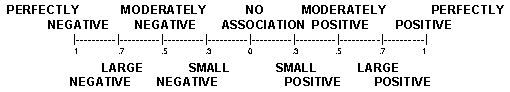
| *Remember! for the categories of cell "a" will be identical for the categories fo cell "d" and exactly opposite for the categories of cells "b" & "c". | ||
|
|
For example above, +.30 is a moderately small positive relationship
between being male and participating in sex for pay.
Tables may be set up in any order. Label them clearly and read
the variables from the upper left hand corner.
Example: Have you paid for or been paid for sex?
| FEMALE | MALE | ||
| YES | 12 | 112 | 124 |
| NO | 822 | 505 | 1,327 |
| 834 | 617 | 1,451 |
= -.30 is a moderately small negative relationship between being
female and participating in sex for pay.
| MALE | FEMALE | ||
| NO | 505 | 822 | 1,3274 |
| YES | 112 | 12 | 124 |
| 617 | 834 | 1,451 |
= -.30 is a moderately small negative relationship between
being male and NOT participating in sex for pay.
| FEMALE | MALE | ||
| NO | 822 | 505 | 1,327 |
| YES | 12 | 112 | 124 |
| 834 | 617 | 1,451 |
= +.30 is a moderately small positive relationship between being
female and NOT participating in sex for pay.
table of contents